| SHDesigns: Embedded Systems Design, Consulting and Developer Resources | Page hits: |
This project actually was developed over a period of 8 years. So it was not a one-shot deal. It just grew over the years.
The problem:
The embedded boards on Lanier's dictation system are difficult to debug. Several commercial products were tested with either poor results, or required an emulator. The processors are soldered in and need to be replaced with a socket to use an emulator. In the field, using an emulator and shutting down a system to install an emulator is not feasible. A software-only solution was needed.
Even with an emulator, the real-time operating system structures were not easily visible. Also, due to how multiple processes were loaded then relocated, commercial software solutions could not resolve the symbol addresses.
Finally, a solution that did not require a developer to travel to the remote site would save much time.
History:
When the DSP boards were initially designed (one of my designs at Lanier,) I included a small debug interface. This operated through the shared window between the card and the PC. This interface allowed downloading FLASH code, examining memory, setting breakpoints and a crude disassembler. It also provided a terminal emulator to allow a PC application to connect to the on-board debug task instead of using the serial interface.
Initially, I developed a small DOS or OS/2 text application that could be used to interface with the card. It was much like the old DOS "debug" utility. It worked fine for simple debugging, but the commands were hard to remember. Symbolic debugging was supported so you could use symbol names as memory addresses.
The development team used emulators for development. This was fine for internal use, but it was a lot of work and was flaky. We found there were things we kept doing repeatedly. Most often just displaying the task list status and a few structures was all that was needed. So, these features were added to the debugger.
One nagging problem with the system was a "7 day lockup." After a week or so, a card would lock up with no memory available. The next feature we added was a "Card Dump" utility. Since the debugger is working on data that is not on the PC, but on another part of the system, it was written to copy data needed locally to view it. It was a simple modification to read the data from a file instead of the card. Then a function was added to dump the entire memory and registers of the card to a file. Now we could have the field dump the card and e-mail us the file. Then, we could run the debugger on the file without any of the hardware present. Comparing dumps taken 7 days apart showed a task that was eating up memory.
The solution:
While developing the PCI version of the DSP cards, the debugger limitations were becoming annoying. Any new data structure that needed to be displayed required modifying the debugger. Other developers still at Lanier were frustrated trying to debug the cards. The system hid some of the symbols so many variables and functions were hard to find.
I asked Lanier if we should expand the debugger to make it more generic, and user friendly. We all agreed that it would be worthwhile as it would save time for all developers. I took it on as a side project, as part of the new system design.
The debugger was written as a Visual C++/MFC application. The system could not run Win32 applications so a companion utility ran on the system. This utility redirected the debugging information to either a serial port or a named pipe. Then, the debug application could connect via a serial cable, modem or network connection. This remote network and modem feature also allowed debugging systems anywhere in the country remotely.
The debugger has multiple child windows (MDI application with no document.) These windows are:
A sample screen is shown below:
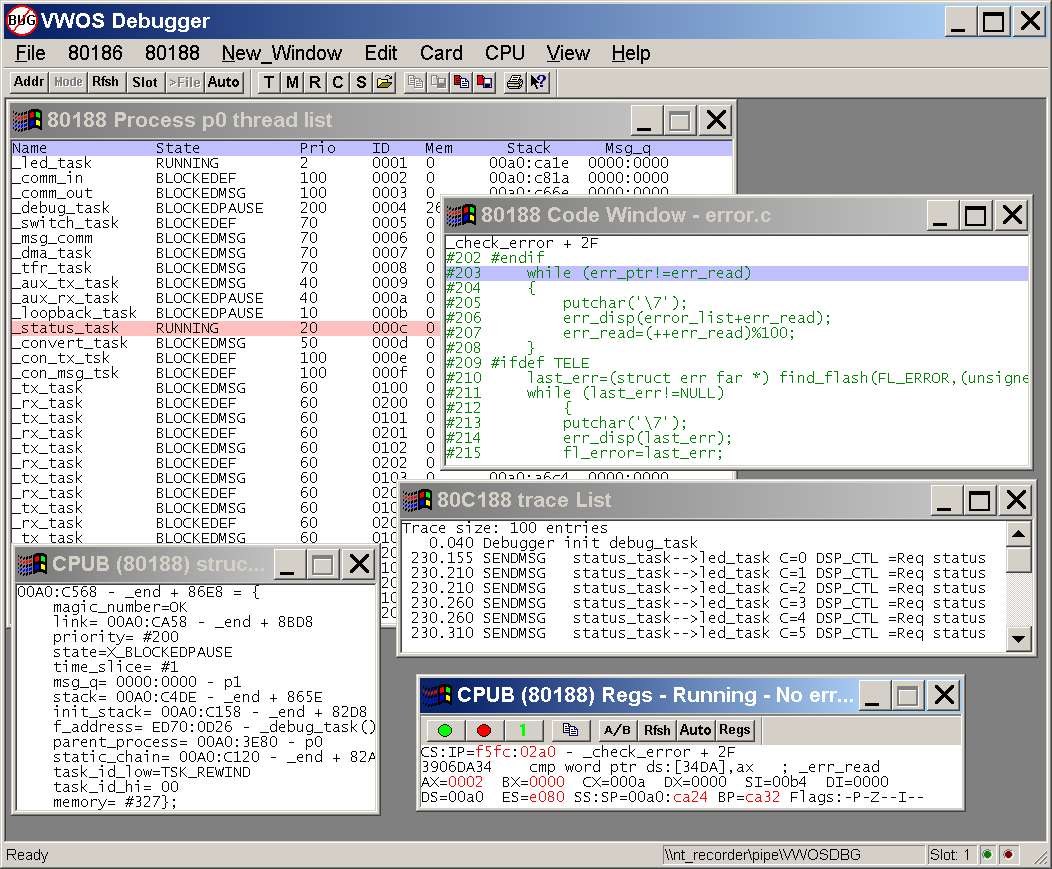
The above picture shows the application in use. It was run on a Windows PC connected to the remote system over a network. Most of the most used windows are displayed. The work required to show this information was significant. The debugger actually reverse-engineers some of the code to find some of the information. System structures are defined in a separate include file so adding new structure definitions only required modifying the file.
The debugger fully understands the multi-tasking features of the system. It can display the data for all processes, something that commercial debuggers could not. It uses the new windows features like toolbars, status bars and context-sensitive help. Right-clicking the mouse on any window will bring up a list of commands appropriate to the data displayed. Displayed data can be copied to the clipboard or saved to a file.
The application is a single executable with no required DLLs. I don't like "bloated" applications the most programmers seem to be happy to develop. The entire program is just over 500k in size. The source code is large with over 15,000 lines of code not including the include files. A included help file fully describes the features of the debugger. It also shows how to set up the remote system, and some debugging strategies. My view of help files and documentation is the more the better. It saves me much time later answering dumb questions.
Development time:
As a side-project to other related projects, it took about 5 weeks to develop. Much of the code from the earlier program was able to be reused, but needed many changes to port it to windows. Using this debugger has proven very productive. We should have dedicated the time earlier, but we were busy developing other products.