| SHDesigns: Embedded Systems Design, Consulting and Developer Resources | Page hits: |
The features are:
An example screen of the Rabbit Debug Console is shown below (sorry
compressed):
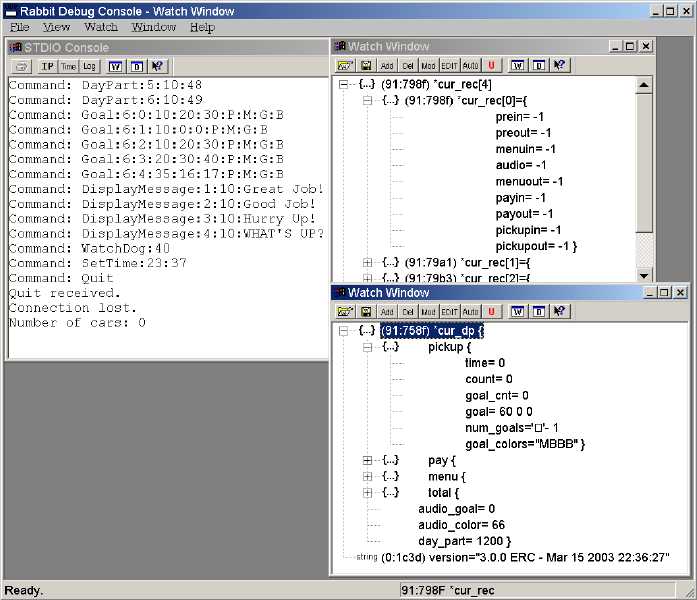
The above sample shows a Rabbit box receiving commands from an NT service and some of the global variables. Notice one of the variables is *cur_rec. The debugger will automatically read the current pointer and then display the structure it points to.
Include printf()'s in your code to output information. You can also input command from the console. When the console is not connected, the printf()'s are ignored. The Rabbit debugger seriously slows down the processor when printf()'s are used. This debug console is very fast and has a low overhead.
Imagine you have a weird problem that occurs once every few days. Fire up the network console, enable time stamps and capture output to a file. Let it run a few days. Then you can look at variables and the log fike later and see when and what error occured.
This application is almost complete. The last part to implement is to write good documentation.
The files can be downloaded here: ![]()